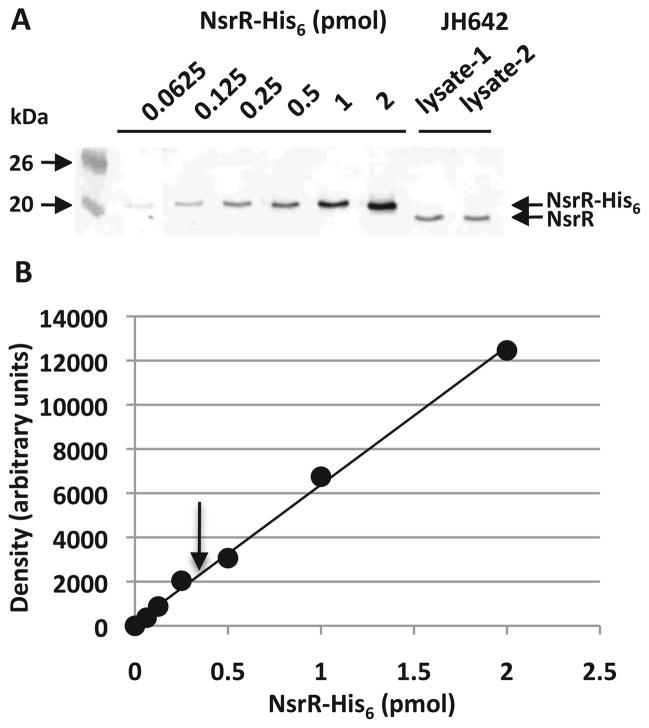
Figure 9.
Determination of in vivo NsrR concentration in B. subtilis cells using quantitative western blot analysis.
A. Western blot of increasing amounts of purified NsrR-His6 together with B. subtilis cell lysate pepared from independent cultures. Molecular weight markers are marked.
B. The standard curve was plotted by quantifying band densitities of NsrR-His6 shown in panel A. An arrow indicates the intensity of NsrR detected in the cell lysate shown in panel A.

