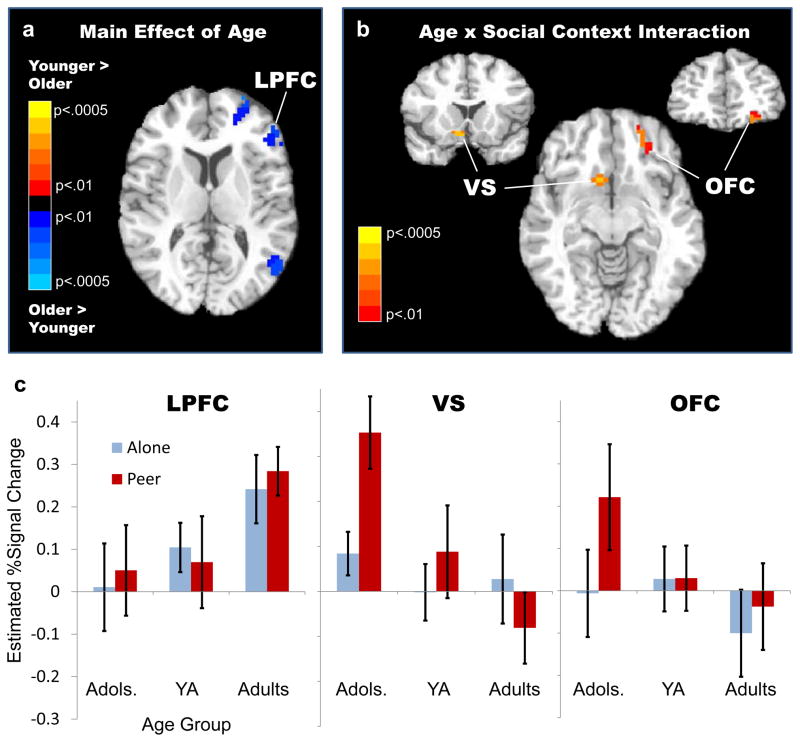
Figure 3.
Regions showing a main effect of age and an age by social condition interaction. (a) Regions showing a main effect of age, including the left lateral prefrontal cortex (LPFC, MNI peak coordinates: x = –46, y = 11, z = 26, BA 46), (b) Regions exhibiting an age × social condition interaction, including the right ventral striatum (VS, MNI peak coordinates: x = 9, y = 12, z = −8) and left orbitofrontal cortex (OFC, MNI peak coordinates: x = −22, y = 47, z = −10), and (c) Mean estimated BOLD signal change (beta coefficients) from the four peak voxels of the LPFC (left), VS (middle), and OFC (right) in adolescents (adols.), young adults (YA), and adults under ALONE and PEER conditions. Error bars indicate standard error of the mean. Brain images are shown by radiological convention (left on right), and thresholded at p < .01 for presentation purposes.

