Figure 1.

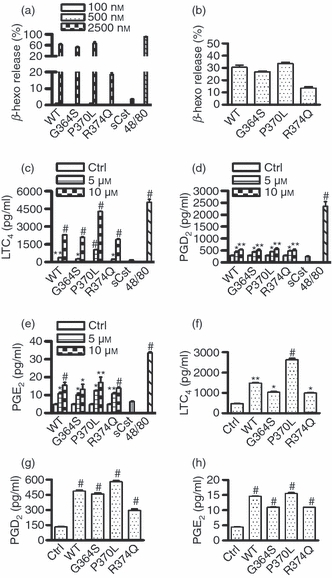
Catestatins induce human mast cell degranulation and release of leukotriene (LT) C4, prostaglandin (PG) D2 and PGE2. (a) LAD2 cells (2 × 10⁵ cells) were incubated with 100–2500 nm wild-type catestatin (WT), Gly364Ser (G364S), Pro370Leu (P370L) or Arg374Gln (R374Q), 2500 nm scrambled catestatin (sCst), 5 μg/ml compound 48/80 (48/80), or diluent 0·01% acetic acid. After 40 min incubation at 37°, β-hexosaminidase (β-Hexo) release was measured in the supernatants as described in the Materials and methods section. Values are the mean ± SD of five separate experiments. (b) Peripheral blood-derived mast cells (2 × 10⁵ cells) were incubated with 5 μm WT catestatin, G364S, P370L or R374Q and β-Hexo release was measured. Values are the mean ± SD of three separate experiments. (c–e) LAD2 cells (1 × 10⁶ cells) were stimulated for 30 min at 37° with 5–10 μm WT catestatin, G364S, P370L or R374Q, 10 μm sCst, 5 μg/ml compound 48/80 (48/80), or diluent 0·01% acetic acid (Ctrl, control). LTC4, PGD2 and PGE2 released into the supernatants were quantified by an enzyme immunoassay. (f–h) Furthermore, peripheral blood-derived mast cells (1 × 10⁶ cells) were incubated 10 μm WT catestatin, G364S, P370L or R374Q, or diluent 0·01% acetic acid (Ctrl, control) as above, and LTC4, PGD2 and PGE2 release was quantified. Values are shown as the mean ± SD of three to six separate experiments, and in comparison with untreated cells (Ctrl, control), respectively. *P < 0·05, **P < 0·01, #P < 0·001.
