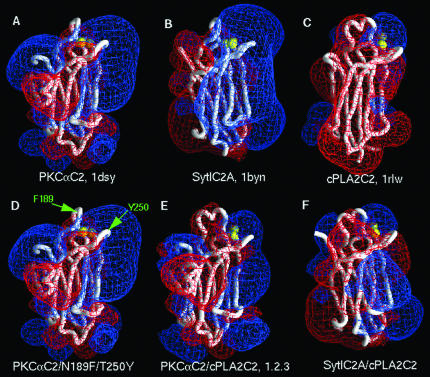
Figure 10.
Electrostatic properties of C2 domains of known structure, mutants, and hybrid models. In each panel, the structure or model is represented as a Cα backbone worm (white), and calcium ions are represented as yellow spheres. The electrostatic potentials were calculated and visualized in GRASP (Nicholls et al., 1991) for 0.1 M KCl. The red and blue meshes represent, respectively, the -25 and +25 mV equipotential profiles. (A) PKCαC2. (B) Syt1C2A. (C) cPLA2C2. (D) PKCαC2/N189F/T250Y; F189 and Y250 are denoted by green arrows. (E)PKCαC2_cPLA2C2_L1.2.3.(F)Syt1C2A_cPLA2 C2_L1.2.3. The structures in A, B, and C were taken from the Protein Data Bank, and the hybrid models in D, E, and F were constructed as described in MATERIALS AND METHODS.

