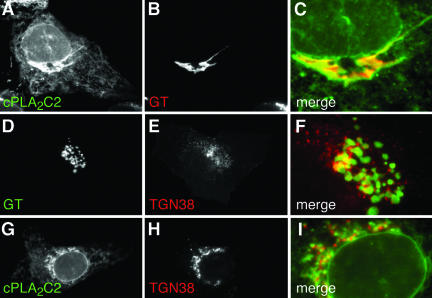
Figure 2.
The cPLA2 C2 domain targets Golgi and ER. Images of a cell coexpressing (A) EYFP-cPLA2C2 and (B) ECFP-GT at 27 s after treatment with 10 μM IONO are shown. A merged image (C) shows the region of the Golgi from A and B. Images of a cell coexpressing (D) ECFP-GT and (E) TGN38-EYFP, and (F) a merged image of D and E in the region of TGN and Golgi are shown. Images of cells coexpressing (G) ECFP-cPLA2C2 and (H) TGN38-EYFP at 30 s after treatment with 10 μM IONO are shown. A merged image (I) shows the region of the TGN. Images are representative of a minimum of five experiments.

