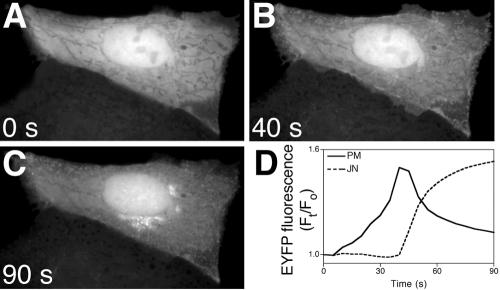
Figure 5.
The Syt1C2A domain exhibits a biphasic pattern of translocation. Images of a cell expressing EYFP-Syt1C2A in medium supplemented with 5 mM CaCl2 treated with 10 μM IONO show distribution of Syt1C2A (A) before, (B) 40 s and (C) 90 s after addition of IONO. (D) Quantification of fluorescence change at areas corresponding to the plasma membrane (PM, solid line) and the juxtanuclear (JN, dotted line) regions of the cell in images A-C. Images and graph are representative of six independent experiments.

