
FIGURE 3.
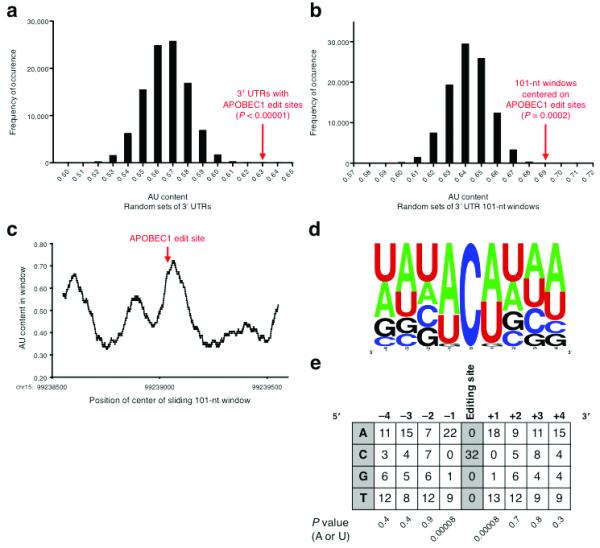
Sequence Features of APOBEC1 Editing Sites. (a) AU content of random sets of 3′ UTRs. The value for the APOBEC1 editing site-containing 3′ UTRs is well to the right of the distribution. (b) AU content of random 101-nt windows within APOBEC1 editing site-containing 3′ UTRs. The value for the windows centered on the editing sites is well to the right of the distribution. (c) AU content in a sliding 101-nt window in the Tmbim6 3′ UTR. The AU content peaks near the editing site, chr15:99239051(+). (d) Frequency plot of bases flanking the APOBEC1 editing sites, aligned on the target cytidine. (e) Base counts of nucleotides flanking the APOBEC1 editing sites. The nucleotides immediately adjacent to the target cytidine tend overwhelmingly to be A or U. P values were computed using the binomial test. For a given column, the P value is the probability that the skew towards A or U is a random occurrence.