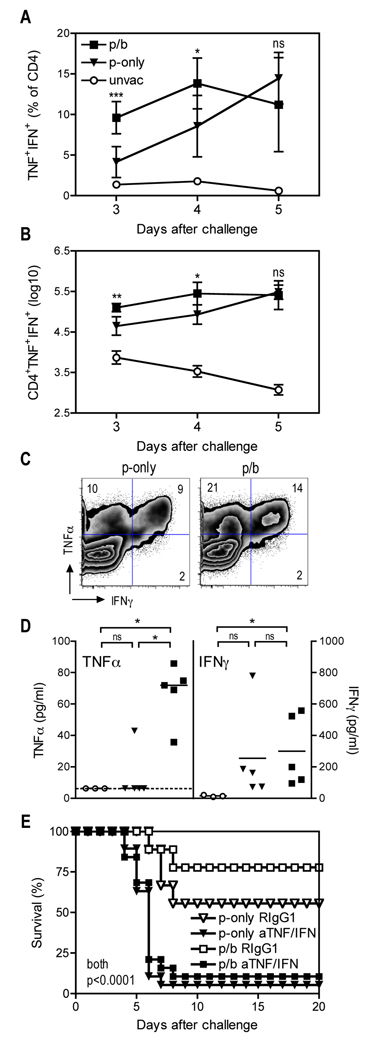
FIGURE 3. TNFα and IFNγ contribute to protection mediated by vaccination with live attenuated Y. pestis.
B cell–deficient µMT mice were primed (p-only; triangles) or prime/boosted (p/b; squares) with D27-pLpxL, or left unvaccinated (unvac; circles), and then challenged intranasally with 200 MLD Y. pestis strain D27 as described in Figure 1. (A and B) At the indicated days after challenge, cells were isolated from lung tissues, restimulated with plate-bound anti-CD3 mAb for 5h, stained for intracellular cytokines and analyzed by flow cytometry. The percentage (A) and number (B) of TNFα+IFNγ+ CD4 T cells are shown. The data depict the mean and SD of 5 mice per group and statistical significance was measured by one-way ANOVA with Bonferroni’s multiple comparison test. Results are shown for p-only versus p/b (* P < 0.05, ** P < 0.01, *** P < 0.001). (C) Flow cytometry analysis of cytokine producing CD4+ T cells at day 4 post challenge. Each plot depicts a concatenation of data from five mice per group. Data shown were gated on CD4+ T cells. The numbers depict the percentage of cells in the indicated quadrant. Similar results were observed in three independent experiments. (D) TNFα and IFNγ protein levels in BALF collected at day 4 post challenge. The broken line depicts the limit of detection (6.4 pg/ml) and the solid bar depicts the median of TNFα and the mean of IFNγ Statistical significance was measured by nonparametric Kruskal-Wallis with Dunn’s multiple comparison test (* P < 0.05; ns, not significant). (E) At the time of challenge, mice received neutralizing mAb specific for TNFα and IFNγ (aTNF/IFN) or an isotype-matched mAb (RIgG1). In comparison with mice treated with isotype-matched mAb, both prime-only and prime/boost mice treated with cytokine-neutralizing mAb exhibited significantly reduced survival (P < 0.0001 by log rank test; n=19 for aTNF/IFN-treated groups, n=9 for RIgG1-treated groups; data are pooled from 2 independent experiments).

