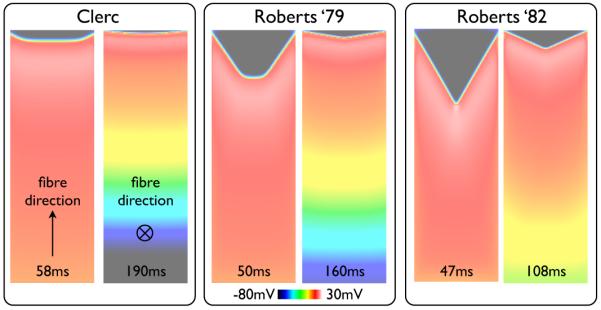
Fig. 3.

Snap-shots of Vm distribution within the slab model following pacing for simulations performed with the BDM approach using the three different standard conductivity sets given in Table I. For each conductivity set, the left image shows the case of propagation along the fibre direction, with the right image showing propagation along the cross-fibre direction. Times of each snap-shot following pacing are shown at the base of each image.
