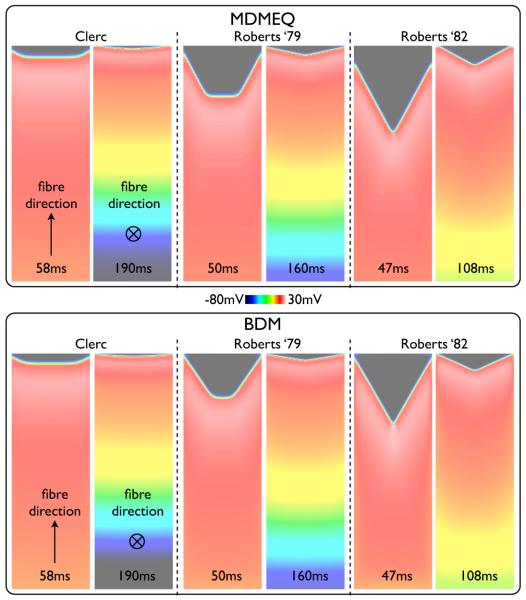
Fig. 7.
Snap-shots of Vm distribution within the slab model following a pacing stimulus with the MDMEQ model (left) using the three different standard conductivity sets given in Table I. For comparison, the same snap-shots from the BDM model are shown (right). For each case, both fibre (top) and cross-fibre (bottom) simulations are also shown, with the time of snap-shot shown at the base of the image.

