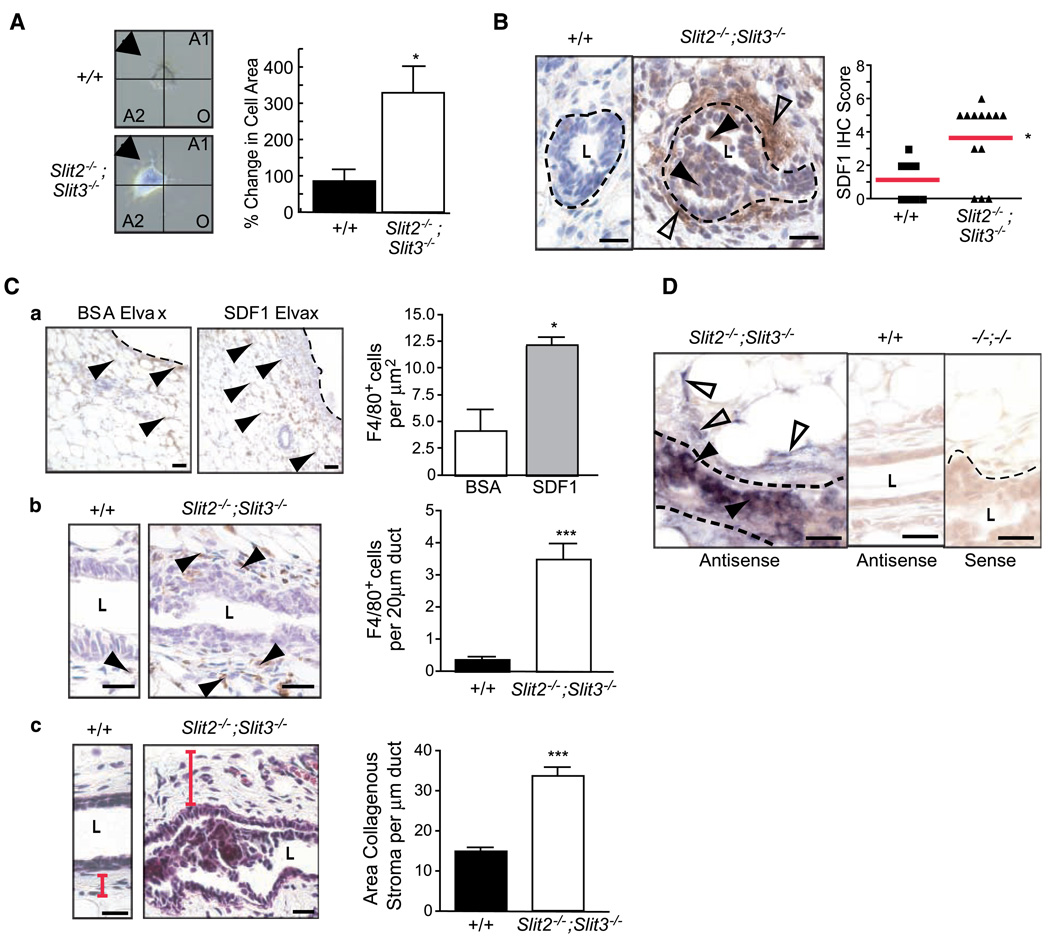
Figure 4.
Loss of Slit expression results in coordinate up-regulation of SDF1 and the formation of desmoplastic stroma. A, Slit2−/−;Slit3−/−, but not +/+, cells respond to a point source of SDF1. Primary epithelial cells were prepared from outgrowths and placed in stable liquid gradients of SDF1 (29). Phase-contrast images were acquired at 0 and 60 min. Using ImageJ, the change in cell area in the source quadrant (arrow) was calculated. Columns, mean percentage change (n = 7); bars, SE. *, P = 0.0018, Mann-Whitney. B, SDF1 protein is present in the stroma surrounding Slit2−/−;Slit3−/− outgrowths. Representative immunostaining with anti-SDF1 on +/+ and Slit2−/−;Slit3−/− mammary outgrowths. Dotted lines, epithelial/stromal interface. Open arrowheads, positive staining in stroma; arrowheads, epithelial cells expressing SDF1. Scale bar, 20 µm. SDF1 immunostaining was scored according to positivity and intensity. Scores were plotted on a vertical scatter plot. Red bars, average score. Significantly more SDF1 staining is seen in Slit2−/−;Slit3−/− outgrowths. *, P = 0.018, Mann-Whitney. C, SDF1 attracts macrophages. a, representative images of F4/80 staining in fat pads containing BSA versus SDF1 Elvax pellets. The number of F4/80+ cells surrounding pellets was counted and expressed as the number of F4/80+ cells per µm2. Columns, average; bars, SD. *, P = 0.0086, unpaired t test. Macrophages surround Slit2−/−;Slit3−/− ducts. b, representative images of F4/80 staining in +/+ versus Slit2−/−;Slit3−/− tissue. Duct length was measured and the number of F4/80+ cells was counted (ImageJ software). Columns, average; bars, SD. ***, P < 0.0001, unpaired t test (n = 3 animals, 10 fields of view/animal). Stroma surrounding Slit2−/−;Slit3−/− ducts is desmoplastic. c, representative images of Masson’s trichrome staining of +/+ versus Slit2−/−;Slit3−/− tissue. Red bar, width of stroma. Longitudinal images of ducts were taken and duct length and positively stained areas were measured (ImageJ software). Columns, average; bars, SD. ***, P < 0.0001, unpaired t test. Scale bar, 20 µm. D, Sdf1 mRNA is specifically present in subpopulations of elongated stromal cells (open arrowheads) and epithelial cells (closed arrowheads) in Slit2−/−;Slit3−/− outgrowths. In situ hybridization on +/+ and Slit2−/−;Slit3−/− outgrowths using antisense probes reveals Sdf1 mRNA in Slit2−/−;Slit3−/−, but not +/+, cells. Sense probes show no or little background staining. Scale bar, 20 µm.

