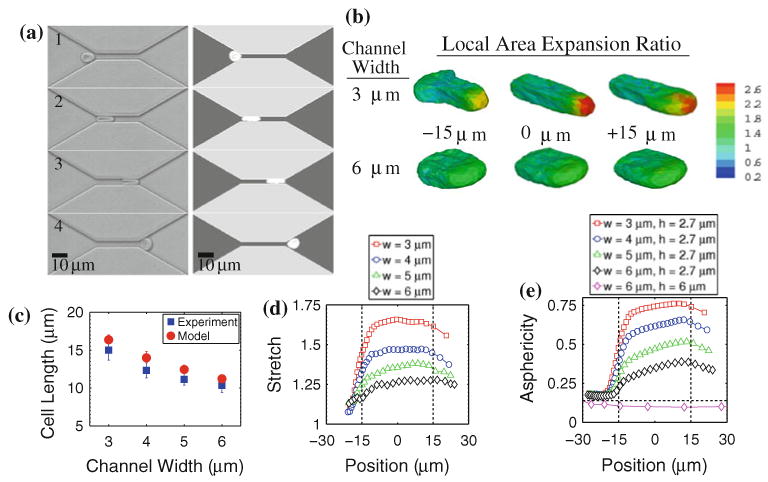
FIGURE 2.

Shape characteristics of RBC traversal across microfluidic channels: (a) experimental (left) and simulated (right) images of erythrocyte traversal across a 4 μm wide, 30 μm long, 2.7 μm high channel at 22 °C and an applied pressure difference of 0.085 kPa; (b) local area expansion contours for an RBC traversing a 3 μm and 6 μm wide (h = 2.7 μm) channel under ΔP = 0.085 kPa; (c) measured and simulated cell lengths at the center of the microfluidic channel for varying channel widths; (d) estimated maximum stretch ratios of RBC spectrin network (simulation results); and (e) asphericity index as the cell passes through different channel widths under ΔP = 0.085 kPa (simulation results). In (d) all channel heights are 2.7 μm. In (e), channel height and width dimensions are indicated. Vertical dashed lines in (d) and (e) indicate locations of channel entrance and exit. Horizontal dashed line in (e) indicates the stress-free, resting asphericity of a normal RBC (α = 0.15).
