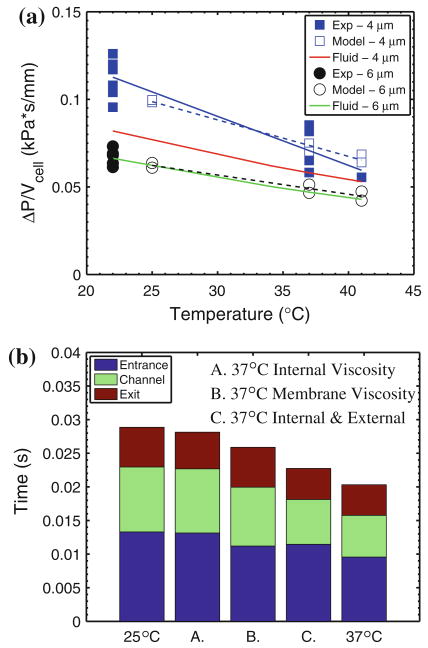
FIGURE 4.
Temperature-dependent RBC flow behaviors. (a) Comparison of DPD simulation results with experimentally measured effects of temperature on ratio of local pressure difference and mean velocity of erythrocyte traversal in a 4 and 6 μm wide (h = 2.7 μm, L = 30 μm) microfluidic channel. Solid data points represent an average of a minimum of 18 cells (all p <0.05 in experimental data); hollow data points represent simulation results from center (lower) and off-center (upper) initial positions of the red blood cells in the large channel. (b) Independent effects of external fluid viscosity, membrane viscosity, and internal fluid viscosity on the modeled flow characteristics of RBCs in 4 μm channels subjected to a pressure difference of 0.14 kPa. For cases, A, B, and C the viscosity of the specified components corresponds to 37°, whereas the viscosity of the rest of the components corresponds to 25°.

