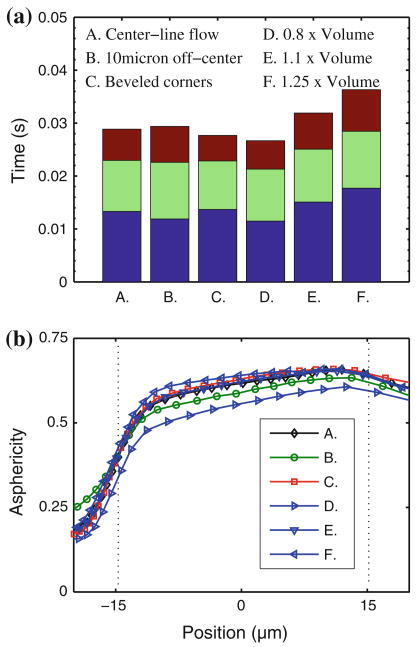
FIGURE 5.
Case studies using the DPD model to evaluate the sensitivity of RBC flow in a 4 μm wide × 2.7 μm high channel subjected to a pressure difference of 0.14 kPa with respect to variations in initial RBC position (B: off-centerline initial position), channel geometry (C: non-rectangular, beveled corner cross-section with the same cross-sectional area), and cell volume (D, E, F: 0.8, 1.1, and 1.25 times the standard cell volume of 100 μm3, respectively). (a) Comparison of entrance, channel, and exit times. Color legend as in Fig. 4b. (b) Asphericity index as a function of cell position. Vertical dashed lines indicate locations of channel entrance and exit.

