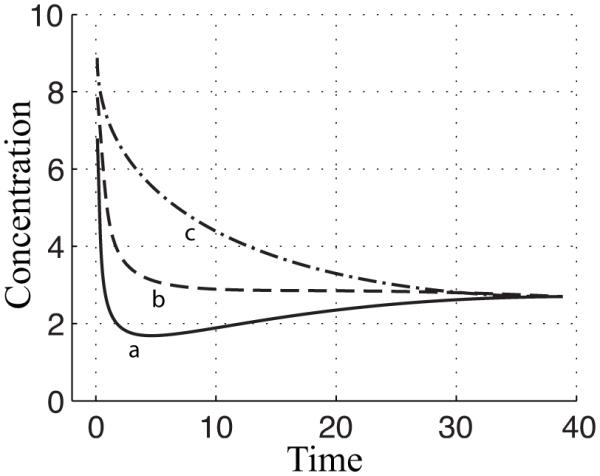
Figure 10.

Illustration of the relationship between peak time and settling time. Curve a exhibits a rapid peak time followed by a slow settling time to reach its final steady state. Curve b exhibits a rapid settling time, but does have a peak. Curve c exhibits a slow settling time and has no peak.
