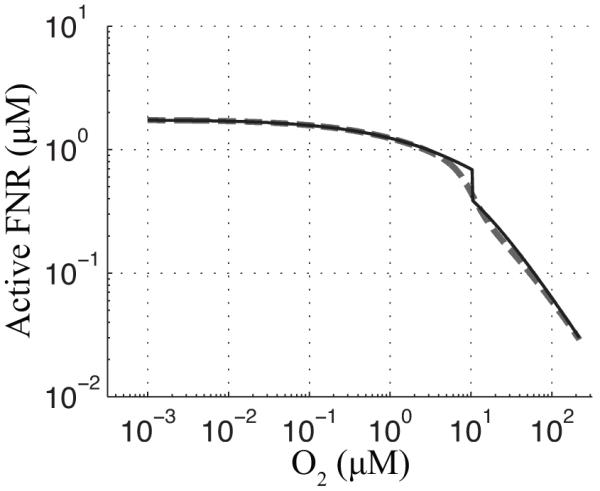
Figure 3.

Standard curve for active FNR concentration as a function of O2 saturation. The curve is calculated, both for the original piecewise model (Tolla & Savageau, 2010) (−) [Eqs. (11)-(13)] and the modified Hill model (- -) [Eqs. (1)-(5)], by setting the derivatives to zero and solving for active FNR (x3) over a range of O2 (x8) concentrations.
