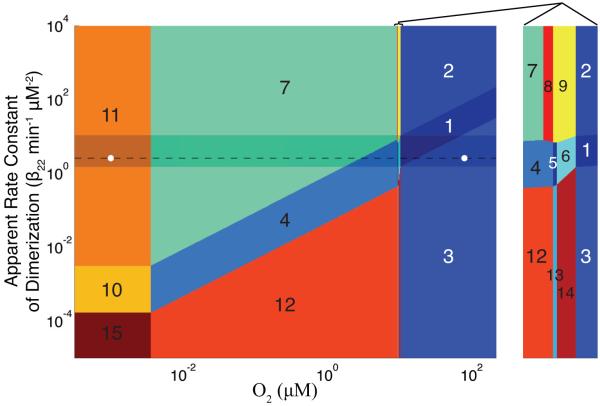
Figure 4.
Design space of the FNR regulatory network in E. coli. Regions (1, 2, 3) to the right of the critical O2 threshold (K2 = 10.4 μM) are associated with the aerobic environment, regions (5, 6, 8, 9, 13, 14) lying next to K2 are associated with the microaerobic environment (see the expanded excerpt), and regions (4, 7, 10, 11, 12, 15) in which O2 is very low or absent are associated with the fully anaerobic environment. The range of O2 concentrations (0.001 to 220 μM) does not exceed the maximum dissolved O2 concentration in the wild at 30° C. The nominal aerobic and fully anaerobic locations (○) are shown along with the path (- -) through the spectrum of phenotypes crossed during the transition between the aerobic/anaerobic growth states. The band of optimal performance (shaded area) prevents crossings into areas of poor performance (see text for discussion).

