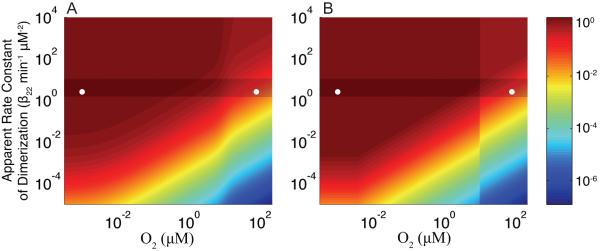
Figure 6.
Comparison of the steady-state solutions (A) computed using the full system [Eqs (1)-(5)] and (B) computed for each phenotypic region. The coloring (z-axis) is the logarithm of the steady-state concentration of active FNR (μM) at each point in the design space, the y-axis is the logarithm of the apparent dimerization rate constant (min−1 μM−2), and the x-axis is the logarithm of the O2 concentration (μM). The shaded area marks the band of optimal performance. The nominal aerobic and anaerobic locations are shown (○).

