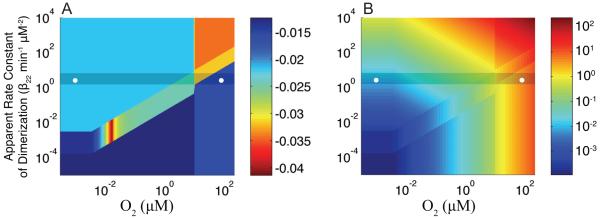
Figure 7.
(A) Dominant eigenvalue (z-axis) plotted over the design space. Dark red corresponds to systems whose local dynamics are faster. (B) Margin of stability as determined by the critical Routh criterion (z-axis) plotted over the design space (coloring is log scaled). Eigenvalues (A) and the margin of stability (B) are calculated for each point in the design space using the subsystem in the relevant region.

