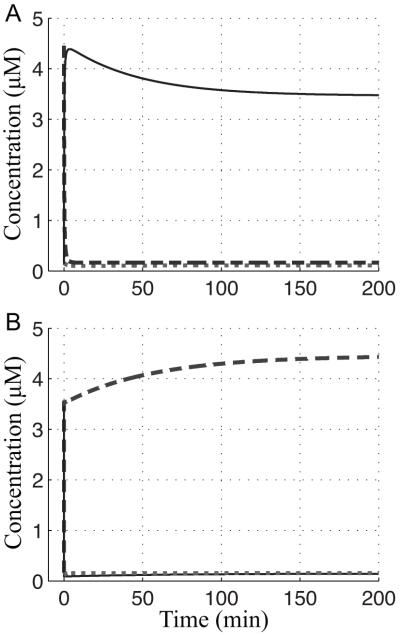
Figure 8.
Global response time with the wild-type values of the parameters. In order to compare inactive FNR (- -) to the active FNR dimer (—), the concentration of dimeric active FNR is plotted as twice the concentration of the monomer. The fnr mRNA level (⋯) barely changes during either transition. (A) The aerobic-to-anaerobic transition: The system begins at the initial steady state (x1 = 0.15, x2 = 4.46, x3 = 0.07 μM) with an O2 level of 80 μM and shifts to the final steady state (x1 = 0.11, x2 = 0.17, x3 = 1.73 μM) with a dissolved O2 tension of 0.001 μM. (B) The anaerobic-to-aerobic transition: The system begins at the initial steady state (x1 = 0.11, x2 = 0.17, x3 = 1.73 μM) with an O2 level of 0.001 μM and shifts to the final steady state (x1 = 0.15, x2 = 4.46, x3 = 0.07 μM) with a dissolved O2 tension of 80 μM.

