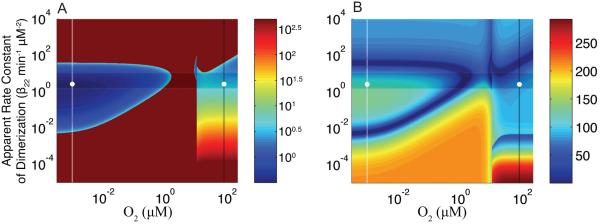
Figure 9.
Global response times for transitions between aerobic and anaerobic environments. Data points to the right of K2 = 10.4 μM (~1 in log space) represent a system starting at that operating point (various values for O2 concentration and apparent dimerization rate constant) and ending at the nominal anaerobic O2 concentration (white line at which [O2] = 10−3 μM, −3 in log space). These correspond to an aerobic-to-anaerobic transition for a system with a specified apparent rate constant of dimerization and wild-type values for the other parameters of the system. Data points to the left of K2 = 10.4 μM represent a system starting at that operating point (various values for O2 concentration and apparent dimerization rate constant) and ending at the nominal aerobic O2 concentration (black line at which [O2] = 80 μM, ~1.9 in log space). These correspond to an anaerobic-to-aerobic transition for a system with a specified apparent rate constant of dimerization and wild-type values for the other parameters of the system. The global response times are plotted as a color (z-axis) at the operating point of origin in each case. (A) Time at which the concentration of active FNR reaches its peak (aerobic to anaerobic) or trough (anaerobic to aerobic). In the event that no peak/trough occurs for a specific set of values the time assigned is 500 minutes (maximum of the time window). (B) Time at which the concentration of active FNR settles to within ± 5% of its final steady-state value. The shaded area in (A) and (B) marks the band of optimal performance. Note that in (A) coloring corresponds to the logarithm of the peak time, whereas in (B) coloring corresponds directly to the settling time.

