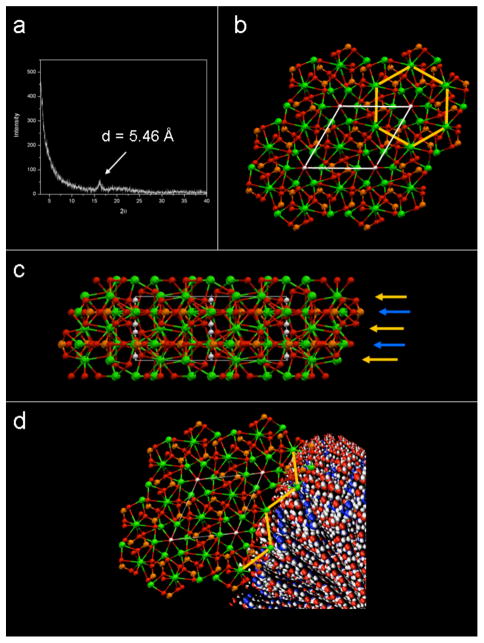
Figure 6.
(a) A powder XRD scan of calcium gelled peptide amphiphile showing a significant peak at 5.46 Ǻ. Peaks corresponding to hydroxyapatite were not observed, and this peak was not present in peptide amphiphile not exposed to calcium ions. (b) Schematic representation of the hydroxyapatite crystal structure as viewed down the c-axis. Atoms are shown as Ca = ( ), P =
  ), O =
  ), H = (○). The white lines depict the borders of the unit cell, while the yellow lines trace interatomic spacings corresponding to 5.45 Ǻ. These calcium ions are arranged hexagonally throughout the 002 planes of the hydroxyapatite crystal. (c) A model of the hydroxyapatite crystal structure as viewed along the [110] direction, showing the planes containing the 5.45 Ǻ-spaced calcium ions (yellow arrows) sitting immediately above planes rich in phosphates (blue arrows). (d) A visualization of a hydroxyapatite crystal nucleating off calcium ions spaced 5.46 Ǻ apart on the PA nanofiber. The hydroxyapatite crystal is shown with the c-axis parallel to the long axis of the PA nanofiber.

