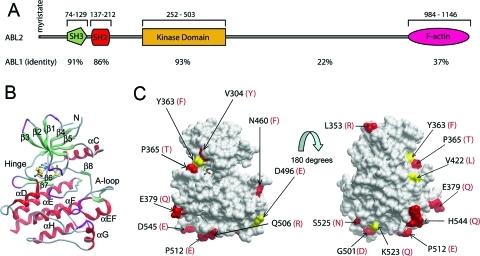
Figure 1.
Structural comparison of ABL2 and ABL1. (A) Domain organization of ABL2, showing residue numbering and the percentage sequence identity to ABL1 for each domain. (B) Ribbon diagram of the structure of ABL2 in complex with the type I inhibitor 2 to show the orientation of the molecule underneath the surface depicted in (C). (Figure 5 shows this interaction in more detail.) (C) Two views of the surface representation of the ABL2 structure are shown, separated by a rotation of 180°. Residues that are conserved with ABL1 are shown as gray surface, semiconserved residues as yellow surface, and residue differences as red surface. The residue differences are numbered in black for ABL2, and the residue letters in red correspond to their counterparts in ABL1. The representation on the left is the same orientation as in (B).

