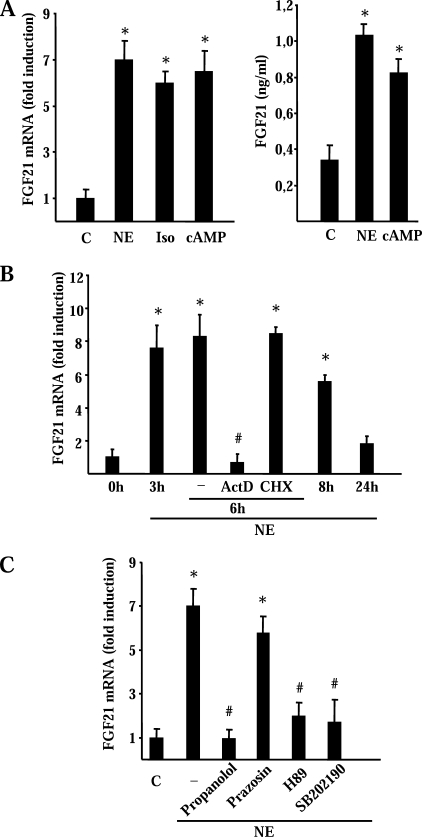
FIGURE 2.
Effects of a noradrenergic stimulus on FGF21 mRNA expression and FGF21 release by brown adipocytes. A, differentiated brown adipocytes in culture were treated with norepinephrine (NE), isoproterenol (Iso), or dibutyryl cAMP (cAMP). Cells were harvested 6 h later (A, left). Cell culture medium was collected 24 h after treatments (A, right). Data are means ± S.E. of relative FGF21 mRNA levels or FGF21 protein in the cell culture medium. Statistically significant differences between the effects of drugs and vehicle control (C, control) are denoted by an asterisk (p < 0.05). B, differentiated brown adipocytes in culture were treated with norepinephrine, and cells were harvested at the indicated times thereafter. Where indicated, 50 μm cycloheximide (CHX) or 1 μm actinomycin D (ActD) were added to the cell cultures. Cells were harvested 6 h later. Data are means ± S.E. of relative FGF21 mRNA levels. Statistically significant differences (p < 0.05) between norepinephrine-treated and untreated cells at each time after addition of NE (0 h) are denoted by an asterisk (p < 0.05), and those between actinomycin D + norepinephrine or cycloheximide + norepinephrine and norepinephrine treatment alone are denoted by # (p < 0.05). C, effects of the adrenergic inhibitors (propanolol and prazosin), the PKA inhibitor (H89), and the p38 MAPK inhibitor (SB202190) on the induction of FGF21 mRNA by norepinephrine. Differentiated brown adipocytes in culture were treated with norepinephrine and the indicated inhibitors for 6 h (see “Experimental Procedures” for concentration data). Data are means ± S.E. of relative FGF21 mRNA levels. Statistically significant differences between the effects of drugs and vehicle control (C, control) are denoted by an asterisk (p < 0.05) and those between drugs + norepinephrine and norepinephrine alone are denoted by # (p < 0.05). Data are means ± S.E. of four to five independent experiments done in duplicate.

