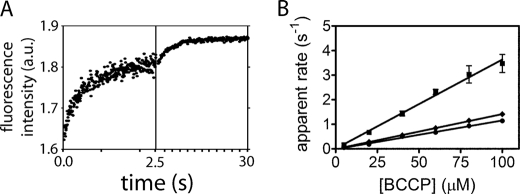
FIGURE 3.
Stopped-flow measurements of biotin transfer. A, fluorescence (arbitrary units (a.u.)) versus time trace obtained upon 1:1 (v/v) mixing of 0.5 μm HsBPL-bio-5′-AMP with 200 μm HsBCCP. To illustrate the double exponential behavior, data were collected in two time windows (0–2.5 and 0–30 s). The solid line represents the best fit of the data to a double exponential model. B, plots of the dependence of the apparent rate of biotin transfer on BCCP concentration: HsBPL-HsBCCP (■), PhBPL-PhBCCP (♦), and EcBPL-EcBCCP (●). The data points represent the average of the apparent rate measured at each BCCP concentration in three independent experiments with S.D. shown as error bars. The solid lines represent the best fits of the rate versus concentration profiles to a linear equation.

