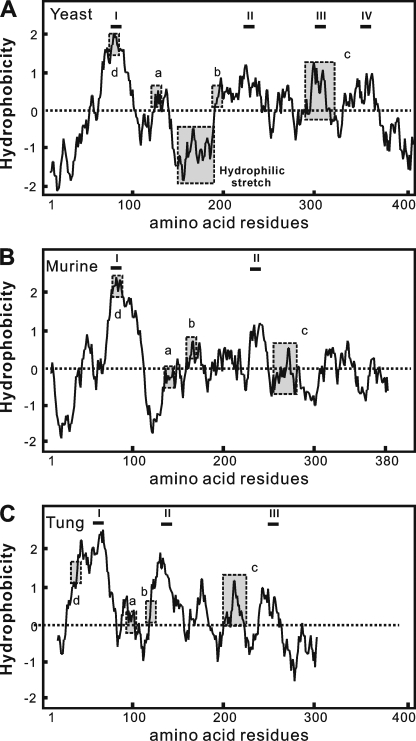
FIGURE 2.
Hydropathy analysis of yeast murine and tung DGAT2s. Aligned hydropathy plots of yeast (A), murine (B), and tung tree (C) DGAT2 proteins were generated by the method of Kyte and Doolittle (30) using a window size of 19. The most hydrophobic segments, which may contain putative TMDs, are indicated by roman numerals. Motifs studied here are boxed and labeled as follows: a, YFP; b, HPHG; c, RXGFX(K/R)XAXXXGXXX(L/V)VPXXXFG(E/Q); and d, putative lipid-binding site.

