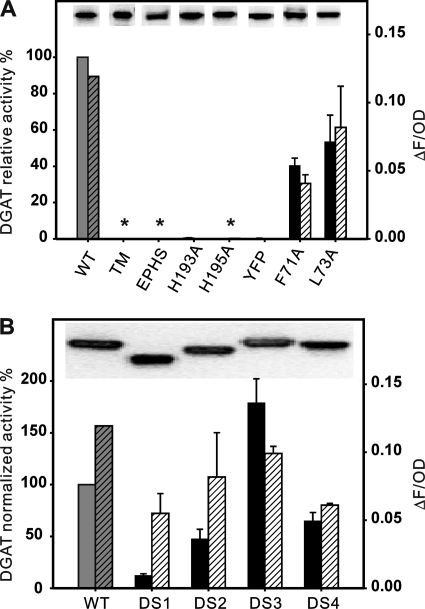
FIGURE 3.
Site-directed mutagenesis of signature motifs. A, performance of mutants TM (Δ70–91), H193A, H195A, EPHS (H193E/G196S), YFP (Y129A/F130A/P131A), F71A, and L73A. In vitro enzyme activities are expressed as picomoles of TG formed per min per mg of microsomal protein and quoted relative to the activity of WT protein (257 pmol/mg protein/min, defined as 100%). Solid bars represent in vitro activity conducted with microsomes from yeast cells expressing V5-tagged ScDGAT2 (WT) and mutants, incubated in the presence of diolein and [14C]oleoyl-CoA, and assayed as described under “Experimental Procedures.” Hatched bars represent the levels of TG accumulation quantified by Nile Red fluorescence (ΔF), normalized by the optical density (OD) at 600 nm, and subtracted from the value obtained for a negative control (LacZ, data not shown). Values represent average ± S.D. (n = 3), and asterisks indicate mutants that did not present activity. Immunoblots of the microsomal proteins prepared from cells expressing these mutants are shown in the insets. B, performance of mutants DS1 (Δ150–187), DS2 (Δ156–174), DS3 (162::163–172), and DS4 (162:: GA5). The in vitro enzyme relative activities (as described in Fig. 3A) are normalized by expression level of the protein that was measured through comparative densitometry analyses of immunoblots. Specific activity of WT protein is 270 pmol of TG/mg protein/min.

