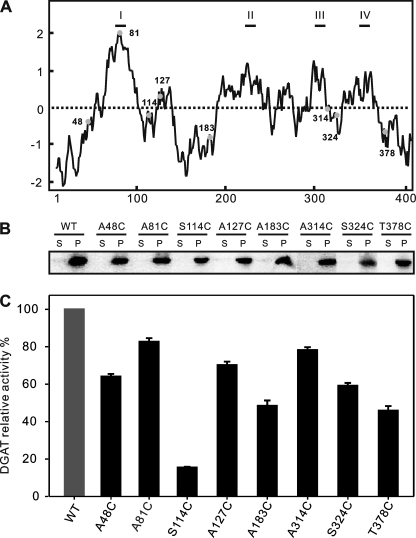
FIGURE 6.
Expression of various single Cys-containing mutants. A, hydropathy plot of ScDGAT2 showing the position and hydrophobicity environments of each introduced cysteine residue (represented by filled circles with the positions numbered). B, immunoblot showing expression of each mutant. The microsomal pellet (P) was separated from the cytosolic protein in the supernatant (S) by 100,000 × g centrifugation. Equal amounts of protein from each fraction were separated by 10% SDS-PAGE and probed with anti-V5 antibodies. C, relative DGAT activities of the single Cys-containing mutants and WT ScDGAT2. Activities were measured as described under “Experimental Procedures.” Data represent means ± S.D. (n = 3). All activities are quoted relative to that of the WT enzyme (set to 100%). The activity of expressed WT enzyme was 600 pmol/mg protein/min.

