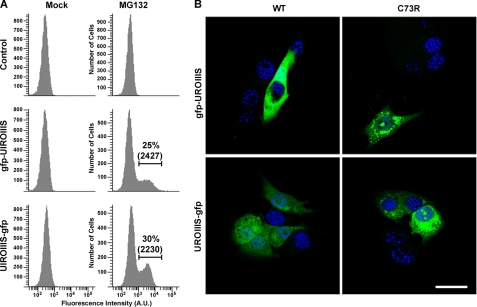
FIGURE 5.
A, GFP fluorescence of unmodified MLP29 cells (control) or cells stably expressing GFP-tagged versions of UROIIIS-C73R in the presence of dimethyl sulfoxide (mock) or MG132 was analyzed by flow cytometry. A threshold for GFP fluorescence was established based on the fluorescence observed for control. Percentage and median fluorescence intensity of GFP-positive cells are indicated. B, representative confocal images of formaldehyde-fixed MLP29 cells stably expressing GFP-tagged versions of WT and C73R proteins. GFP fluorescence (green) and DAPI nuclear staining (blue) of different cells are shown. Scale bar, 45 μm.

