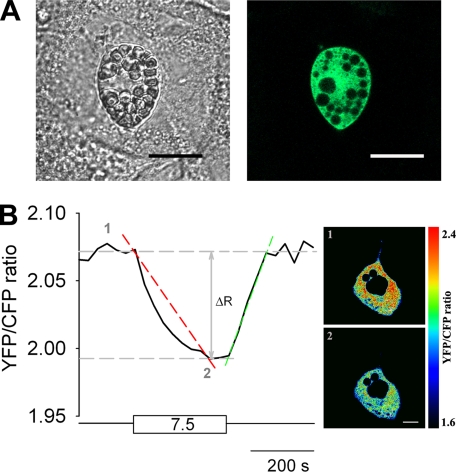
FIGURE 1.
The expression and the activity of glucose nanosensor. A, a transmitted light image (left) and a fluorescence image (right) of a 3T3-L1 adipocyte transiently expressing the glucose nanosensor FLIPglu-600μ in the cell cytoplasm. Black spots on the fluorescent cell image are lipid droplets and cell organelles. Scale bar, 20 μm. B, diagram showing modulations of the ratio between fluorescence intensities of YFP and CFP in response to changes in external glucose concentration in a single cell. The cell was incubated in extracellular glucose-free medium (bottom straight horizontal line), and during superfusion, the cell was supplied with 7.5 mm extracellular glucose (rectangular box). The diagram also presents the parameters measured in experiments. The red dashed line marks the rate of ratio decline over time (dR/dt) during the time of superfusion with glucose medium until the steady state in YFP/CFP ratio was reached, as a measure for the rate of glucose load, and the green dashed line marks the rate of ratio increase over time (dR/dt) during the time of superfusion with glucose-free medium until the steady state in ratio was reached, as a measure for the rate of glucose clearance. The vertical arrow marks the amplitude (ΔR) of the YFP/CFP ratio change after the addition and removal of glucose from the extracellular solution, respectively (left panel). Pseudocolored ratio images (right panel) show glucose-dependent YFP/CFP ratio changes. Red indicates high ratio or low glucose (1, upper cell image; 0 mm Glc in extracellular solution), and blue indicates low ratio or high glucose (2, lower cell image; 7.5 mm Glc in extracellular solution). Scale bar, 10 μm.

