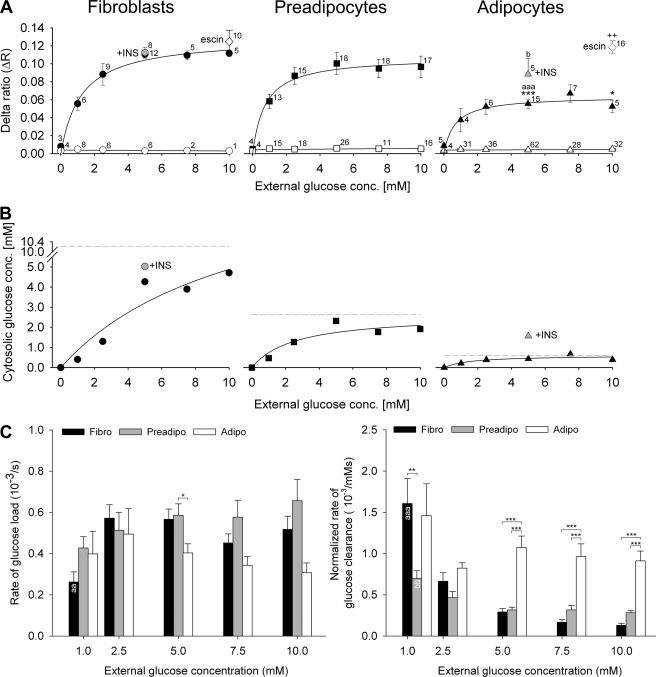
FIGURE 4.
Determination of cytosolic glucose concentration at different external glucose levels. A, extracellular glucose-dependent mean ΔR of 3T3-L1 fibroblasts, preadipocytes, and adipocytes. Delta ratios were calculated as the difference between the average YFP/CFP ratios during superfusion with and without glucose in the superfusion medium. The numbers adjacent to the symbols indicate the numbers of measurements for explicit extracellular glucose concentrations (conc.) obtained from responsive (filled symbols) and unresponsive (open symbols) cells to alternating extracellular glucose concentration. Gray symbols denote insulin (INS)-stimulated measurements. White diamonds are mean measurements of permeabilized cells with β-escin. Differences in delta ratios were compared: ΔR of adipocytes versus ΔR of fibroblasts (*); ΔR of adipocytes versus ΔR of preadipocytes (a); ΔR of insulin-stimulated versus ΔR of non-stimulated conditions (b); ΔR of permeabilized versus ΔR of non-permeabilized cells (+). Statistical significance is denoted: * and b, p < 0.05; ++, p < 0.01; aaa and ***, p < 0.001. For statistical comparison of groups, Student's t test and ANOVA analysis were employed. The curves represent best fits obtained by non-linear regression and the equation Δr = (ΔRmax × [Glc]extra)/(Kd + [Glc]extra). B, ratio changes were transformed into cytosolic glucose concentrations using Equations 1 and 2. Gray symbols denote mean values of cells stimulated with insulin. Note that in insulin-stimulated adipocytes, cytosolic glucose concentration increased by a factor of 3.6 when compared with non-stimulated adipocytes. Solid lines are best fits of one-site saturation ligand binding curve. Dashed gray lines represent the predicted maximal values of cytosolic glucose concentrations: 10.2 mm in fibroblasts, 2.6 mm in preadipocytes, and 0.6 mm in adipocytes. C, rates of glucose load and clearance at different external glucose supply in fibroblasts (Fibro, black bars), preadipocytes (Preadipo, gray bars), and adipocytes (Adipo, white bars). Statistically significant differences between rates of different cell groups at the same external glucose supply are denoted: *, p < 0.05; **, p < 0.01; ***, p < 0.001. The rate of glucose load in fibroblasts at 1 mm extracellular glucose is significantly slower from all higher concentrations of glucose supply (aa). The rate of glucose clearance in fibroblasts at 1 mm is significantly slower when compared with rates at all higher external glucose concentrations (aaa), and the rate of glucose load in preadipocytes at 1 mm is significantly slower when compared with rates at 5, 7.5, and 10 mm external glucose concentrations (bb).

