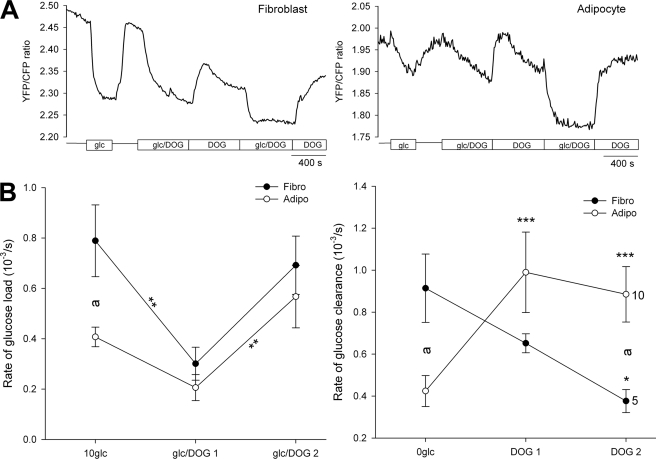
FIGURE 5.
Intracellular glucose levels in the presence of 2-deoxyglucose. A, representative recordings of the YFP/CFP ratio in a 3T3-L1 fibroblast (left panel) and a 3T3-L1 adipocyte (right panel) superfused with DOG (30 mm) in the presence or absence of 10 mm extracellular glucose (rectangular boxes). B, the effect of DOG on the rate of glucose load (left panel) after the addition of extracellular glucose (10 mm) and clearance (right panel) obtained after superfusion with glucose-free extracellular solution in fibroblasts (black dots) and in adipocytes (white dots), measured as dR/dt. The numbers adjacent to the symbols indicate the numbers of cells tested; error bars show S.E. Significant differences are denoted: a and *, p < 0.01; **, p < 0.01; ***, p < 0.001, two-way RM ANOVA.

