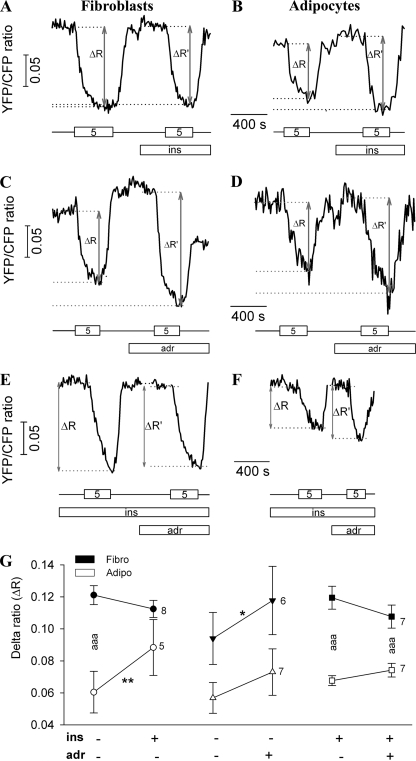
FIGURE 6.
Effects of insulin and adrenaline on ΔR. A and B, the graphs show a real time recording of the YFP/CFP ratio during the superfusion with alternating glucose concentrations (0 and 5 mm). Insulin (100 nm) was present in extracellular medium during the second half of the experiment (lower bar). Gray arrows represent the delta ratio before (ΔR) and after (ΔR′) the addition of insulin. The numbers in the boxes indicate the concentration of extracellular glucose (in mm), and the lines between the boxes indicate the glucose-free solution. C and D, the graphs show YFP/CFP ratio recordings in a fibroblast (C) and in an adipocyte (D) during the superfusion with alternating glucose concentrations (0 and 5 mm) before and after adrenaline application. ins, insulin. E and F, representative recordings of the effect of adrenaline on insulin-stimulated YFP/CFP ratio change in fibroblast (E) and adipocyte (F). Insulin (100 nm) was present in the extracellular solution from the start of the recording (ins, middle bar), whereas adrenaline (adr, 1 μm) was added in the second part of the experiment (lower bar). Gray arrows represent delta ratio before (ΔR) and after (ΔR′) the addition of 1 μm adrenaline. G, scatter-line plot shows ΔR before and after insulin addition (left), adrenaline addition (middle), and adrenaline addition in insulin-stimulated cells (right) in fibroblasts (Fibro, black symbols) and in adipocytes (Adipo, white symbols). Numbers adjacent to symbols indicate number of cells tested; error bars show S.E. Asterisks indicate significant differences (*, p < 0.05; **, p < 0.01; aaa, ***, p < 0.001; two-way RM ANOVA).

