FIGURE 7.
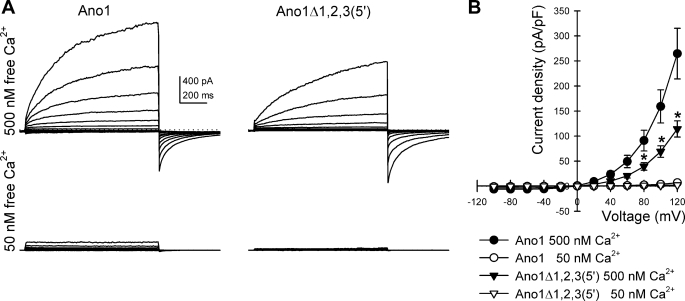
Ano1Δ1,2,3(5′) shows altered current density at high voltages. A, outwardly rectifying chloride currents recorded from HEK293 cells transfected with full-length Ano1 or with Ano1 isoform with alternative 5′ end (Ano1Δ1,2,3(5′)) at a free intracellular Ca2+ concentration of 50 and 500 nm showing that the Ca2+ dependence of the chloride currents was preserved. Dotted line, 0 pA. B, current-voltage graph for the chloride currents at 1 s showing a difference in current density at 500 (filled symbols) and 50 nm (empty symbols) Ca2+ concentrations. At 500 nm, significant differences were observed between the full-length (circle) and Ano1Δ1,2,3(5′) isoform of Ano1 (triangle) tested at voltages higher than 80 mV (n = 8–10). *, p < 0.05.

