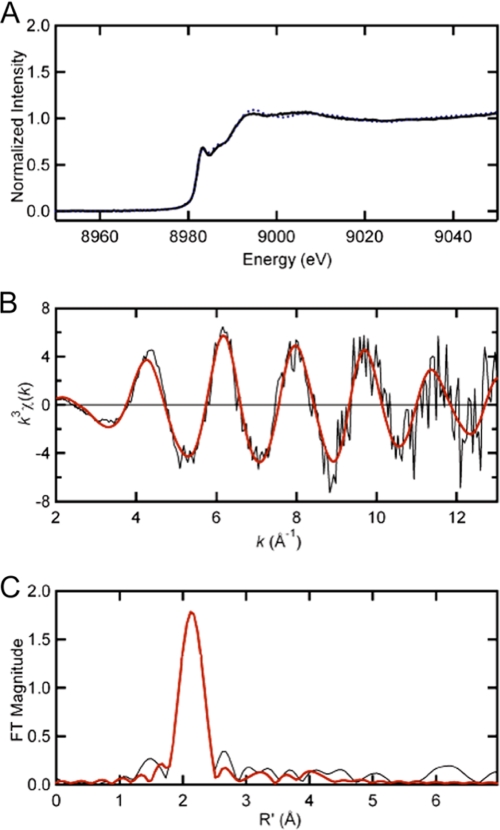
FIGURE 2.
X-ray absorption spectroscopy (XAS) of Cu(I)-bound Sau CsoR. A, copper K-edge x-ray absorption edge spectra of Cu(I)-bound WT Sau CsoR (solid black) and Mtb CsoR 1–106 (dashed blue) (16). The copper K-edge EXAFS spectrum and Fourier transforms (k3 weighted, k = 2–13 Å−1) for Cu(I)-bound WT Sau CsoR are shown in panels B and C, respectively. The solid red curves in panels B and C represent the best fits with parameters compiled under supplemental Table S2.

