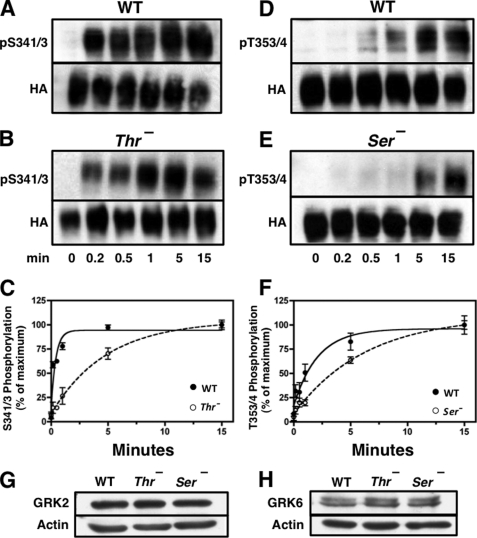
FIGURE 3.
Rate of receptor phosphorylation is reduced by mutation of upstream or downstream phosphorylation sites. CHO cells stably expressing either the WT receptor or the Ser− or Thr− mutant receptors were stimulated with 10 nm SS14 at 37 °C for various times. Cells were then solubilized, and equal protein samples from each treatment group were purified by adsorption to WGA-agarose followed by SDS-PAGE and immunoblotting with the phospho-specific antibodies shown. Subsequently, membranes were stripped and probed with HA antibody to control for receptor loading. The intensity of the receptor bands was quantitated as described under “Experimental Procedures,” and phosphorylated receptor was normalized for total receptor level and expressed as a percent of the signal at 15 min. Panels A and B show a representative experiment in which phosphorylation of Ser-341/343 was measured in either the WT receptor (panel A) or the Thr− receptor (panel B). Panels D and E show a representative experiment in which phosphorylation on Thr-353/354 was determined in either the WT receptor (panel D) or in the Ser− mutant receptor (panel E). Panels C and F shows the mean ± S.E. for site-specific receptor phosphorylation in WT and mutant receptors from three independent experiments. The half-time for Ser(P)-341/343 phosphorylation was 0.23 ± 0.06 min in the WT receptor and 3.34 ± 0.34 min in the Thr− mutants (p < 0.0001). The half-time for Thr(P)-353/354 phosphorylation was 1.19 ± 0.19 min in the WT receptor and 4.80 ± 1.92 min in the Ser− mutants (p < 0.0001). Panels G and H show the level of GRK2 and GRK6, respectively, in the cells expressing WT receptor and the Ser− or Thr− mutant receptors. Actin was used to determine equal loading.

