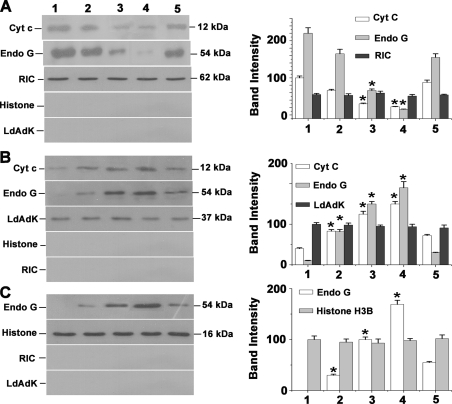
FIGURE 6.
TM induces Cyt c and Endo G release from mitochondria to cytosol and translocation of Endo G from cytosol to nucleus. A, Western blot analysis of Cyt c and Endo G in mitochondrial fraction of 0.2% DMSO-treated control and TM (20 μg/ml)-treated cells. Lane 1 represents DMSO-treated control. Lanes 2–4 indicate cells treated with TM for 2, 4, and 8 h, respectively. Lane 5 denotes pretreatment with NAC before treatment with TM for 8 h. B, Western blot analysis of Cyt c and Endo G in cytosolic fraction. C, immunoblot analysis of Endo G in nuclear fractions of control (0.2% DMSO-treated) and TM-treated cells. All the data are representative of at least three independent experiments. The asterisks indicate the level of statistical significance (0.05). RIC, mitochondrial RNA import complex I; LdAdK, L. donovani adenosine kinase. * indicates the level of statistical significance (0.05).

