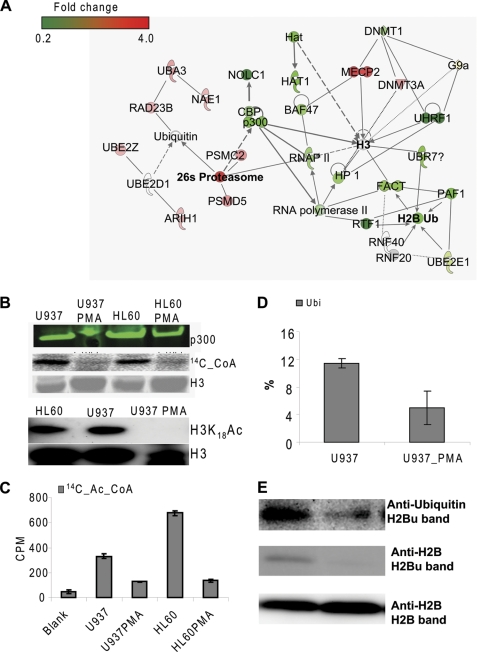
FIGURE 5.
p300 degradation and histone hypoacetylation and H2B deubiquitination. A, network established by IPA from differential protein expression results determined by mass spectrometry. B, Western blot analysis of p300 expression (top), acetyltransferase activity of the whole cell lysates (middle), and Western blot analysis of H3 Lys-18 acetylation (bottom). C, acetyltransferase activity of immunoprecipitated p300. D, H2B Lys-120 ubiquitination analyzed by LC-MS/MS-MRM. E, Western blot analysis of H2B ubiquitination using anti-ubiquitin and anti-H2B.

