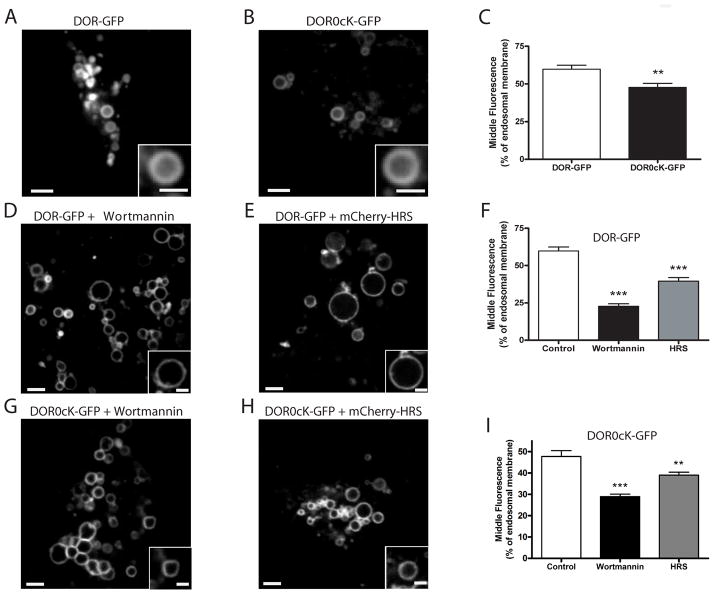
Figure 3. Differences in the extent of DOR transfer to ILVs can be detected by live-cell imaging of non-enlarged endosomes.
A and B) Live cell imaging of non-enlarged endosomes in HEK293 cells expressing either F-DOR-GFP (A) or F-DOR-0cK-GFP (B) imaged live by spinning disc confocal microscopy after exposure for 90 minutes to 10μM DADLE. Shown are representative still images of the representative acquired image series (see Supplemental Movie 1 and 2. Scale bars are 2μm and 1μm for the insets. C) Quantification of the middle fluorescence, or percentage of endosomal membrane, measured from individual endosomes. Mean and SEM of middle fluorescence values are shown for F-DOR-GFP transfected cells (DOR-GFP, n= 12 cells, 50 endosomes) and F-DOR0cK-GFP transfected cells (** p<0.01, Student's t-test, n=59 endosomes, 13 cells). D-F) The same experiment in cells transfected with F-DOR-GFP and pretreated with 500nM wortmannin (D) or transfected 48 hours before DADLE addition with mCherry-HRS (E). Scale bar on overall image = 2μm and on inset = 1 μm. F) Fluorescence intensity was measured through the center of the endosome as in (A-C) and the mean internal fluorescence is expressed as a percentage of that of the membrane of wortmannin pre-treated F-DOR-GFP transfected cells (Wortmannin, unpaired t-test; ***, p<0.0001, n= 11 cells, 50 endosomes), and F-DOR-GFP and mCherry-HRS transfected cells (HRS, unpaired t-test; ***, p<0.0001, n= 10 cells, 64 endosomes). D) The same experiment in cells transfected with F-DOR0cK-GFP and pretreated with 500nM wortmannin (G) or transfected 48 hours before DADLE addition with mCherry-HRS (H). Scale bar on overall image = 2μm and on inset = 1 μm. I) Quantification of the middle fluorescence. Mean and SEM of middle fluorescence values are shown for wortmannin pre-treated F-DOR0cK-GFP transfected cells (Wortmannin, unpaired t-test; ***, p<0.001, n= 11 cells, 92 endosomes), and F-DOR0cK-GFP and mCherry-HRS transfected cells (HRS, unpaired t-test; **, p<0.01, n= 10 cells, 116 endosomes).

