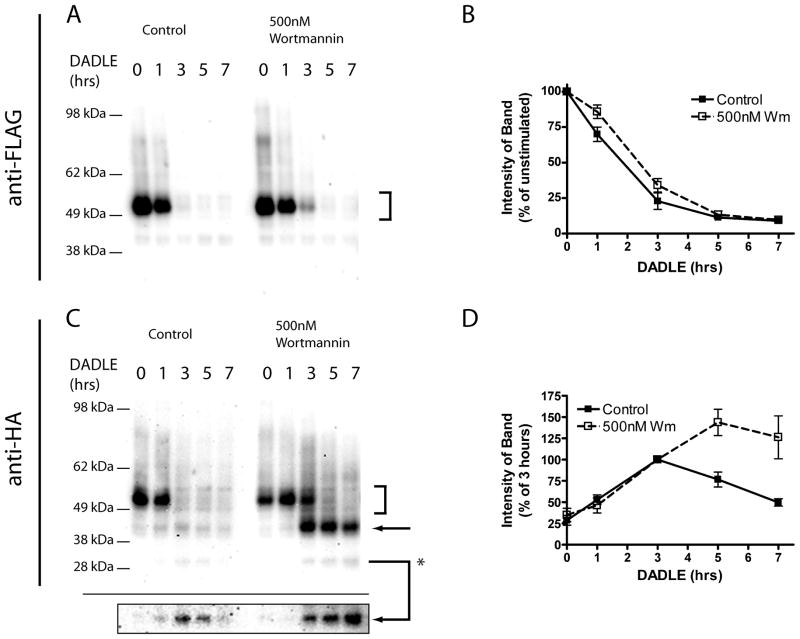
Figure 7. Persistence of proteolytic cleavage products is mimicked by treatment with Wortmannin.
HEK293 cells stably expressing F-DOR-HA were pretreated with vehicle control (DMSO) or 500nM Wortmannin before incubation with 10μM DADLE for the indicated time period before lysis and division into two identical samples. Shown are representative anti-FLAG (A) or anti-HA (C) Western blots. Arrows denote major proteolytic cleavage products, and the highlighted box shows a darker exposure of the proteolytic product at ~30kDa. Blots generated across multiple experiments were scanned and densitometry performed to estimate the amount of FLAG-tagged receptors remaining at each time point relative to agonist naïve cells (C), and the relative abundance of one anti-HA immunoreactive proteolytic product (denoted *) expressed as a percentage of density at 3 hrs agonist treatment (D). Shown are the mean and SEM of multiple experiments (n=6); closed symbols indicate densitometry in control, DMSO treated cells, and open symbols indicate cells treated with 500nM Wortmannin.

