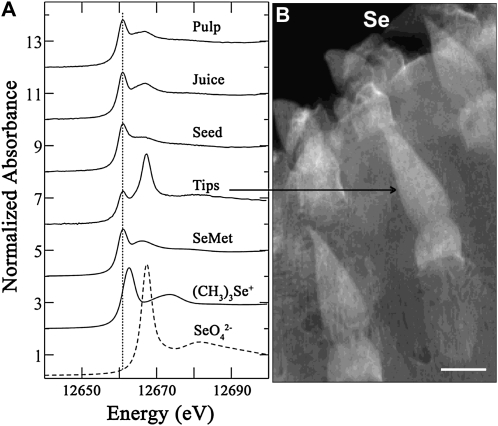
Figure 3.
A, Normalized Se K-edge XANES spectra of different Opuntia samples. Reference spectra of SeMet, trimethylselenonium ion [(CH3)3Se+], and SeO42− are shown for comparison. The SeO42− spectrum is shown as a dashed line. The dotted line indicates the peak position of SeMet standard. B, Distribution of Se in Opuntia by μXRF map showing the spatial distribution of Se (coded in white) in young cladode. Bar = 1 mm.

