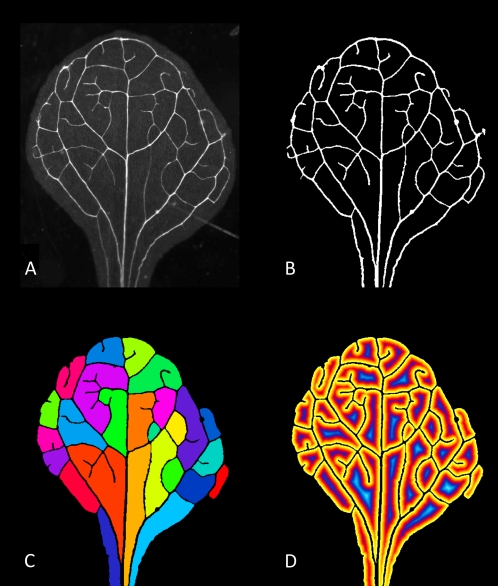
Figure 1.
Series of Arabidopsis images including, original image (A), results of thresholding and cleaning (B), colored labeled areoles (C), and the results of a distance transformation on the areoles (D). These images serve to demonstrate the utility of the software for analyzing images, such as those that might be found in developmental studies. Image in A graciously provided by E. Scarpella and originally published by Donner and Scarpella (2009).

