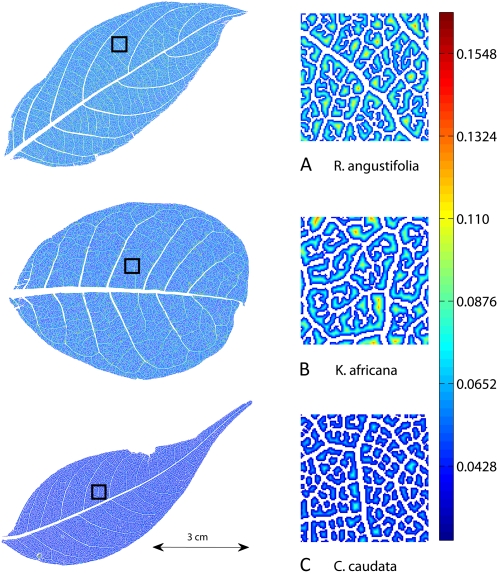
Figure 3.
Three leaves showing the results of vein segmentation and distance transformation options. The zoomed-in regions to the right correspond to the portions of the leaves within the black square on each whole-leaf image at left. Corresponding summary statistics for these three leaves are in Table I. Increasing distance from the nearest vein is indicated by colors at the yellow/red end of the spectrum as in the scale bar at right (mm). Note that the areoles and distance to nearest vein are generally smaller in C. caudata and larger in K. africana as also indicated in Table I.

