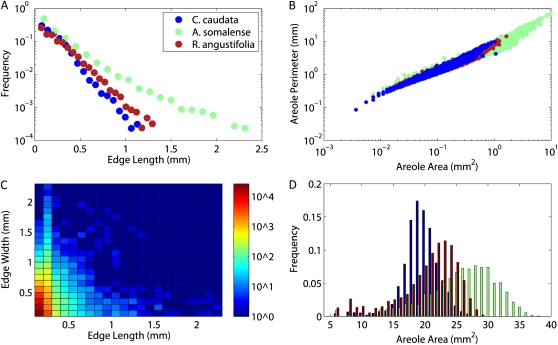
Figure 4.
Examples of some figures that can be generated from the statistics computed by the LEAF GUI software for the three leaves shown in Figure 3. Data shown are for illustration purposes only. A, Frequency distribution of vein lengths. B, Heat map of combined edge length and width frequencies. C, Plot of individual areole perimeter versus area. D, Histogram of areole area frequencies.

