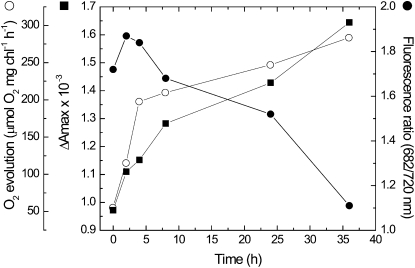
Figure 6.
Time course of recovery from Mn limitation. Synechocystis 6803 cells were grown on YBG11-0 for 14 d. At time zero, MnCl2 was added to a final concentration of 1 μm. Oxygen evolution rates (white circles), P700 ΔAmax (black squares), and the 682/720-nm 77 K chlorophyll fluorescence intensity ratio (black circles) were monitored throughout the recovery phase. Oxygen evolution was measured in the absence of artificial acceptors. The addition of DMBQ and ferricyanide to limited cells improved the oxygen evolution rate by 5%. At 24 h into the recovery process, the addition of acceptors improved the rate by 65%.

