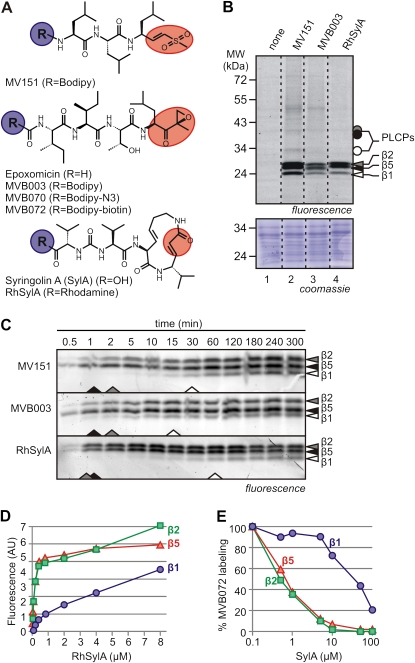
Figure 1.
Characterization of three probes for in vitro proteasome labeling. A, Inhibitors and probes used in this study. Probes and inhibitors are based on vinyl sulfone (top), epoxomicin (middle), or SylA (bottom). The reactive groups are indicated in red. Probes carry a reporter tag at position R (blue). B, Comparison of in vitro labeling with the three probes. Extracts from cell cultures were labeled for 2 h with 2 μm MV151, RhSylA, or MVB003. Proteins were detected from protein gels by fluorescence scanning and Coomassie Brilliant Blue staining. Dashed lines indicate lanes combined from the same gel. C, Time course of proteasome labeling. Arabidopsis leaf extracts were labeled with 2 μm MV151, MVB003, or RhSylA, and samples were taken at different time points and quenched in SDS sample buffer. Fluorescent proteins were detected by fluorescence scanning. Arrowheads at the bottom of the gels indicate the probe concentrations required for half-maximal labeling. D, Labeling by SylA at different probe concentrations. Arabidopsis leaf extract was labeled with various concentrations of RhSylA, and signals of the different subunits were quantified from protein gels and plotted against the RhSylA concentration. E, Suppression of proteasome labeling at different SylA concentrations. Arabidopsis leaf extracts were preincubated with various SylA concentrations and labeled with 2 μm MVB072. Signals of the different subunits were quantified from protein gels and plotted against SylA concentration. Fluorescence was normalized to the no-inhibitor control.

