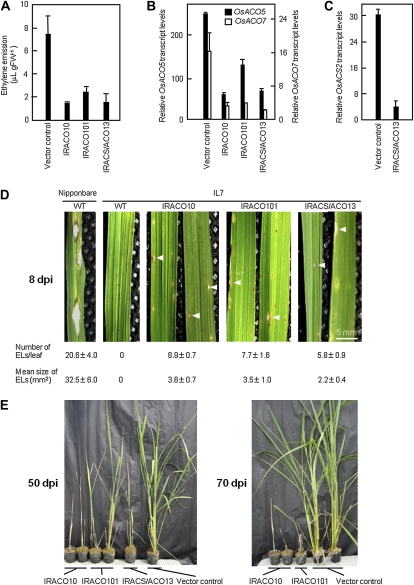
Figure 2.
Breakdown of Pi-i-originated blast resistance in ACO/ACS knockdown rice plants. A, Ethylene emission from leaves. Ethylene concentrations emitted from leaves at 36 to 60 hpi were normalized with the amount of fungal DNA extracted from the inoculated leaves at 60 hpi. B and C, Relative transcript levels of OsACO5 (B), OsACO7 (B), and OsACS2 (C) genes in leaves at 48 hpi, which were normalized with fungal DNA levels. For A to C, the values are means ± se (n = 12). D, Distinct lesion types were apparent in leaves at 8 dpi. Numbers of ELs with an area greater than 0.5 mm2 per leaf and their mean areas were determined using 11 leaves for wild-type (WT) Nipponbare, 30 leaves for wild-type IL7, 12 leaves for IRACO10, 19 leaves for IRACO101, and three leaves for IRACS/ACO13. Values given are means ± se. One leaf per plant was used. White arrowheads indicate typical ELs in whitish brown. E, Phenotypes of ACO-silenced and control IL7 plants grown in a greenhouse. Left, 50 dpi; right, 70 dpi. For A to E, similar results to wild-type IL7 were obtained by transgenic IL7 plants transformed with the vector alone.

