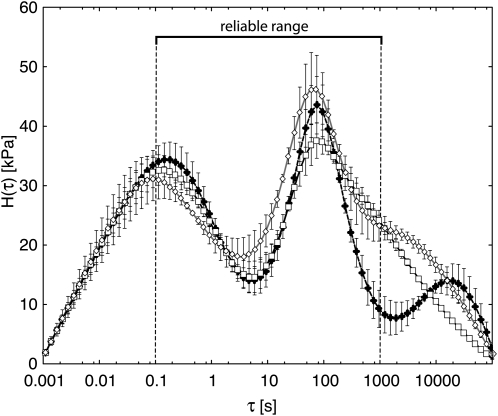
Figure 5.
Relaxation spectra corresponding to data in Figure 3 (A–C) fitted using BayesRelax with the smoothing constraint. Squares indicate the wild type, white diamonds indicate T7.2, and black diamonds indicate T13.1. Bars show the 67% probability range for each calculated point (see “Materials and Methods”).

