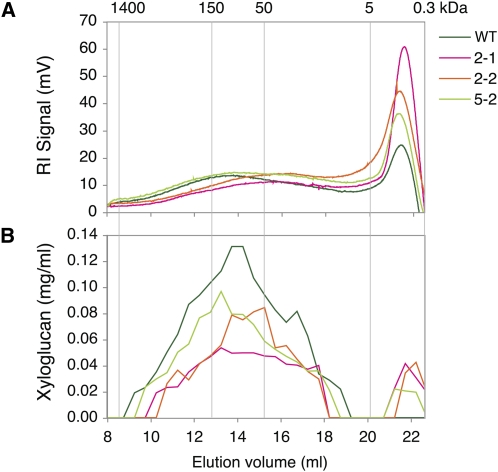
Figure 5.
Molecular size distribution of the hemicellulose fraction of polysaccharides from xylem 1 tissues of OE and wild-type (WT) lines (pooled samples from five to six trees per line) extracted with 24% KOH and analyzed by size exclusion chromatography. Polysaccharides were detected by monitoring the refractive index (RI) of the eluate (A), and xyloglucan concentrations in different fractions were determined by iodine staining (B). Line designation is as in Figure 3. The molecular masses of dextran standards in kD are shown above the graph.

