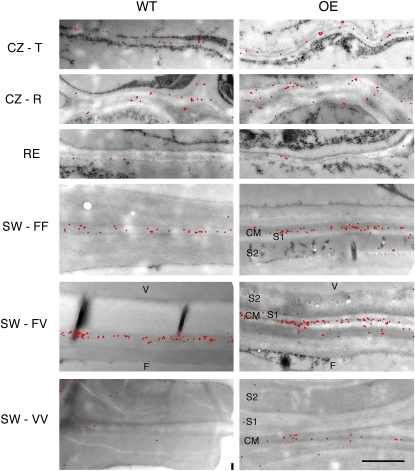
Figure 8.
Distribution of CCRC-M1-labeled xyloglucan (red dots) in cell walls along the wood development gradient in the wild type (WT) and transgenic PtxtXET16-34-OE lines for which quantitative labeling data are presented in Figure 7. CM, Compound middle lamella; F, fiber; S1 and S2, successive secondary wall layers; V, vessel element. Other labels are as in Figure 7. Except for the cambial zone, all presented walls are radial. Bar = 1 μm.

